In this final installment of my series on TDFS (Time Domain Frequency Sweep) analysis, I’ll focus on measuring impedance vs. frequency. I’ll first demonstrate the method by showing the measurement of input impedance for a switching power converter. Then I’ll extend that method to analyze the “impedance stability” of a distributed power system. Power systems may include many DC to DC converters, some acting as sources and other as loads. They may also be distributed over significant distances, so that the impedance characteristic of the interconnecting cables (a.k.a. transmission lines!) becomes an important stability factor.

The key stability metric is the ratio of the source to load impedance, Tm = Zsource/Zload, as defined in the paper STABILITY OF LARGE DC POWER SYSTEMS ...*. This paper describes the impedance specification design approach used for the International Space Station Electric Power System. Generally, Tm stability assessment can only be performed on power systems for which “AC analysis” is applicable. TDFS extends that approach to direct measurement of systems containing switching and sampled-data control aspects, without requiring state-average and other analytical linearization techniques.
Input Impedance vs. Frequency
As discussed in Parts 1 and 2 of this Series, TDFS uses a time-domain measurement that produces a frequency response result. In this case, a time domain simulation is performed and the computed impedance results are given as complex values vs. frequency, just like those of an “AC” or frequency-domain analysis.
TDFS Input Impedance of Step-Down DC to DC (Buck) Converter - Switching

The example circuit above demonstrates an input impedance measurement for a step-down or “buck” DC/DC switching power converter**. There is no need for a state-average or continuous equivalent model of the circuit. Rather, the actual switching components can be used directly. The circuit is converting a 12V DC input to a regulated 5V output, while supplying a 5A current to the 1 Ohm load resistor.
The impedance measurement is performed over the range 3 kHz to 30 kHz. Note that at low frequency, the impedance magnitude (dark blue waveform) is approximately 5 Ohm, with phase (red waveform) of -175 degrees, indicating it is a “negative resistance”. The value of 5 Ohms corresponds to the 1 Ohm actual load resistance, multiplied by to the square of the conversion ratio:
1 Ohm * (12/5)^2 = 5.76 Ohms (approx. 5 Ohms, reduction due to losses in the converter)
The nearly 180 degree phase is due to the constant power nature of the system. If the input voltage to the buck converter changes, the output voltage remains constant because it is regulated. This means that the output current and power delivered to the 1 Ohm load resistor are also constant. The reflection of this “constant output power” to the input implies that if the input voltage rises, the input current will fall, as expected for a “negative resistor”.
This behavior can be observed directly in the time domain waveforms. In the zoom region near the 2ms mark, the line voltage (brown waveform) and the input current (green waveform) are almost completely out of phase at this time, when the stimulus frequency is 3 kHz. Also note in the un-zoomed time-domain waveforms, as the frequency of the constant amplitude voltage stimulus is increased, the current amplitude decreases. This corresponds to the increased impedance magnitude at higher frequencies.
Impedance Stability Analysis
In this section, the same switching DC/DC converter with input impedance measured above, is used in a “down hole” LED lighting application for a drilling rig camera. The regulated output voltage drives 3 parallel 8.4 Watt LEDs. The converter is supplied through a 400 meter power cable with 8 AWG wire. An 18V battery is used to accommodate the DC voltage drop of the cable.
TDFS Impedance Stability of Transmission Line Fed LED Driver - Switching
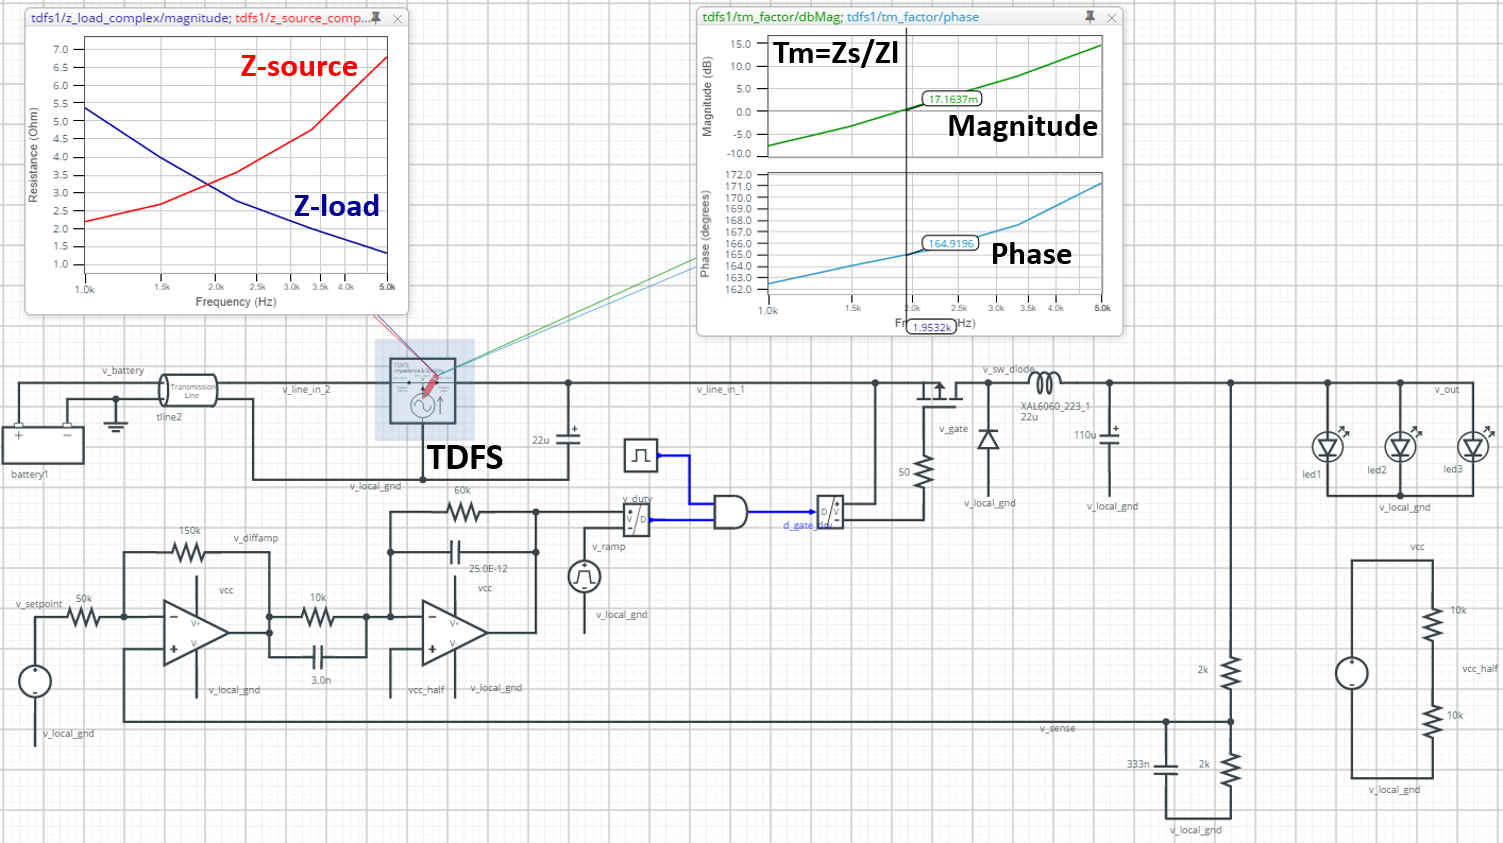
But a long cable has a more “complex” characteristic than DC resistance! J To measure it, as well as the converter input impedance, the TDFS impedance stability measurement model injects a 0.2A sinusoidal stimulus current, at the point where the cable connects to the converter. It monitors the voltage at that point, as well as the stimulus current splits toward the source and the load. The associated source and load impedances vs. frequency are computed from these three measured values. In addition, the ratio of the source to load impedance (Tm) is computed. Like the open-loop frequency response requirement for closed-loop system stability, Tm must not have magnitude = 1.0 and phase = 180 degrees at any frequency.
The results show that the impedance ratio magnitude (green waveform) reaches unity, or 0 dB, at approximately 2 kHz. The phase (light blue waveform) is approximately 165 degrees at that point, which implies a phase margin of 15 degrees.
Transient Simulation for Verification
To verify this stability margin, a transient test circuit similar to the TDFS configuration above was used (click on the link below to see the “live” version of that design). A switch was added to delay the application of power to two of the circuit’s LEDs, in order to inject a load transient event. For the 400 meter cable configuration, underdamped ringing is observed in the buck converter’s input current (dark blue waveform, left chart) and voltage (red waveform). The measured overshoot is 0.822A, which is just under 70% for this current step change. This closely matches the expected step response for a system with 15 degrees phase margin, as measured using TDFS.
Transient Stability Testing of Transmission Line Fed LED Driver

The ringing and the corresponding TDFS phase margin are sensitive to cable length, as well as the value of the input filter capacitor of the converter. The reader is invited to copy the “live” circuit, change these design parameters and run new simulations to see the impact of those changes. For example, if the cable length is increased to 800 meters the power system becomes unstable, as shown in the chart on the right.
More to this Series!
In Parts 1 and 2 of this blog series, I discuss other TDFS measurement capabilities and models that are provided in PartQuest Explore. In Part 1, I show the most basic use of TDFS, for simple transfer function (i.e. gain and phase) measurements of switched capacitor and mixed-signal filter circuits. In Part 2, I show how you can assess the closed-loop stability (i.e. open-loop gain and phase margin) for circuits and systems that include switching, modulation or sampled-data control aspects.
--------------------------------
* E.W. Gholdston (Rocketdyne), K. Karimi (Boeing), F.C. Lee, J. Rajagopalan, Y. Panov (Virginia Tech.) and B. Manners (NASA), “STABILITY OF LARGE DC POWER SYSTEMS USING SWITCHING CONVERTERS, WITH APPLICATION TO THE INTERNATIONAL SPACE STATION”, 31st Intersociety Energy Conversion Engineering Conference, 1996. IECEC 96-96079
** This is the same step-down or “buck” converter that was shown in Part 2 of this Blog Series: Closed Loop Stability Analysis For Switching And Sampled-Data Circuits And Systems


